Zandplas 2007
September 6, 2012 Excel GIS VSTO
For Cubic Square BV, I have built an Excel add-in using VSTO. This add-in, Zandplas2007, is used to calculate the coordinates and volume which would result from an excavation of a specified area, where each side has a user-defined steapness. The add-in outputs the data to the Excel sheet, and outputs a graphical representation to an image.
The input data for the add-in is a set of coordinates which represent the outer side, or round-trip, of the area to be excavated. Each side also has a steepness, called slope. The following screenshot shows the input screen. User-input fields are marked yellow. The round-trip is specified at the ‘Punten’ area; each slope is specified at the ‘Taludnr’-areas. Text is in dutch.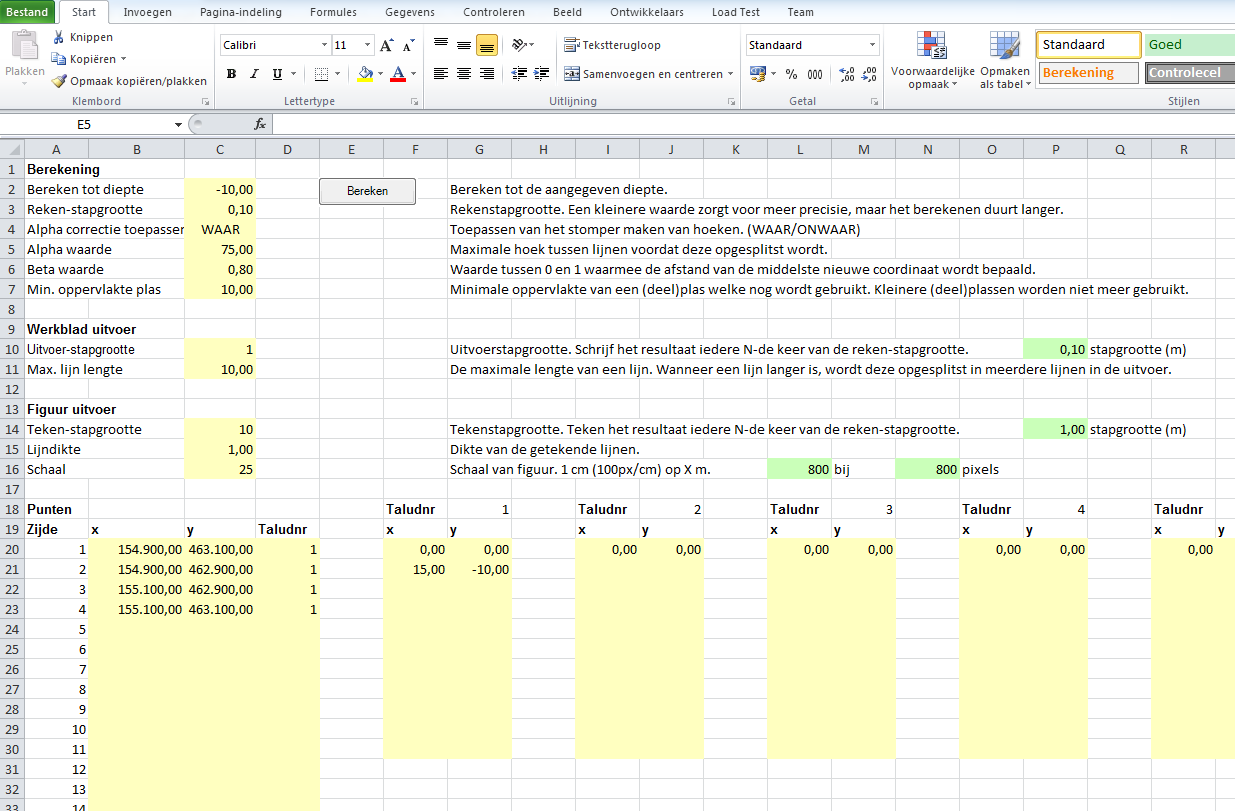
When the user presses the ‘Calculate’-button (‘Berekenen’ in the screenshot), the add-in reads the input, validates it for correctness and starts calculating. The calculation involves applying the steepness to the round-trip. The specified steepness can vary over height. For example, the first 0m to 5m, the steepness can be 0.10m forward per 1m downward. For the next 5m to 20m the steepness can be 0.50m forward per 1m downward. The next figure shows an example of this. The red line gives the direction of the slope. After the first few downward-iterations, a gap occurs, which is actually a flat bank.
The calculation includes further heuristics, such as merging two neighbouring points when the distance between these points becomes less a given distance. These points are merged to a single point in the round-trip. An example is shown in the next figure. The two coordinates marked by a red circle are merged to the green coordinate. In the next iteration, the coordinates marked green and purple are merged to the yellow-marked coordinate.
Another feature is the ‘stumping’ of sides for which the angle is too sharp. The side is made less sharp by introducing additional points to the round-trip. The figure below shows an example of this. The two sides with a sharp edge, marked red, is made more stump by adding an extra side.
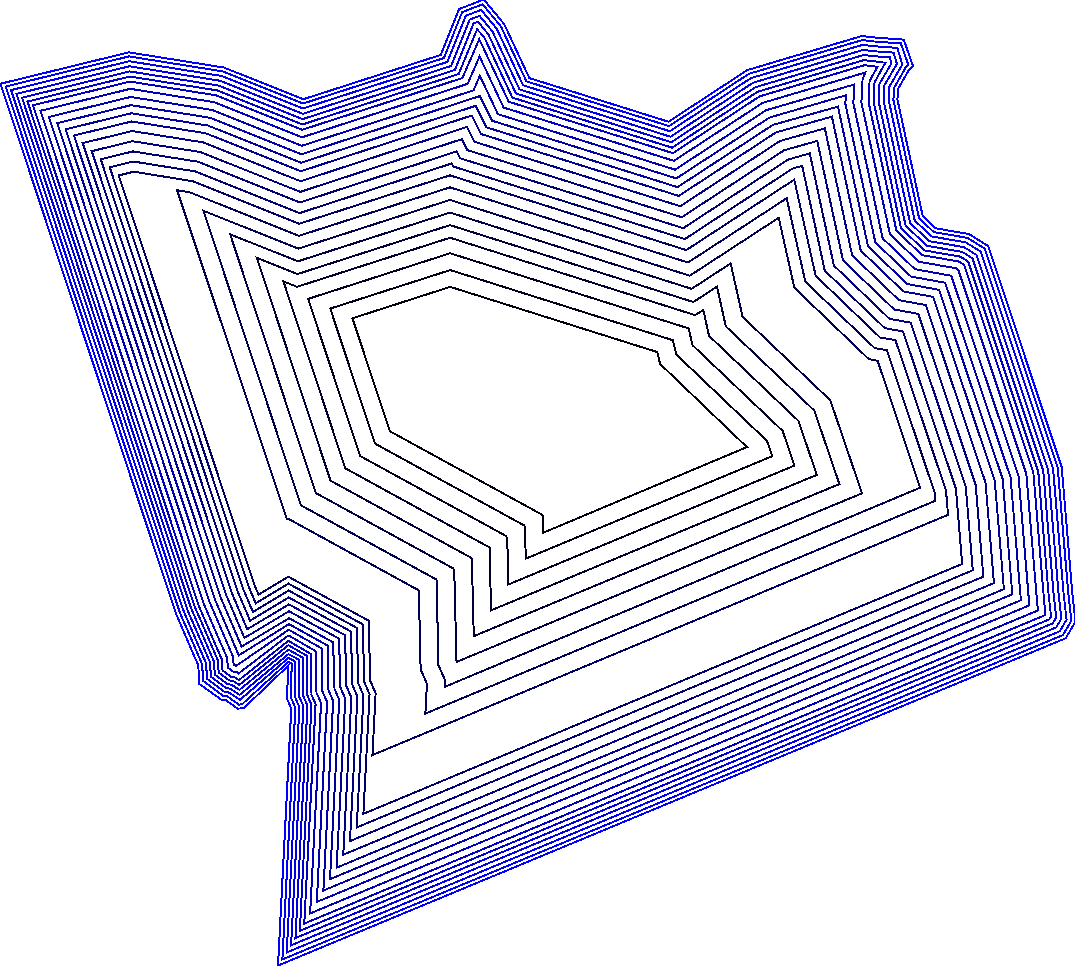
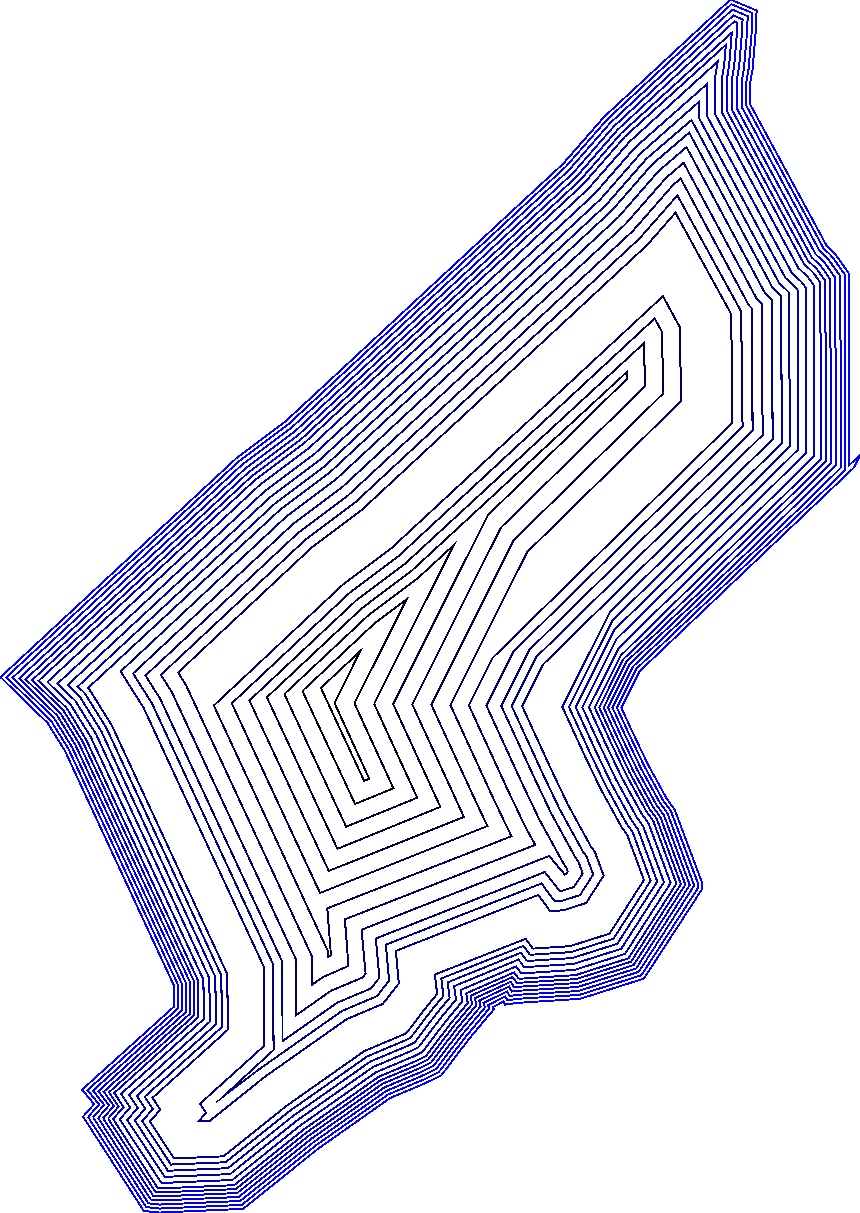
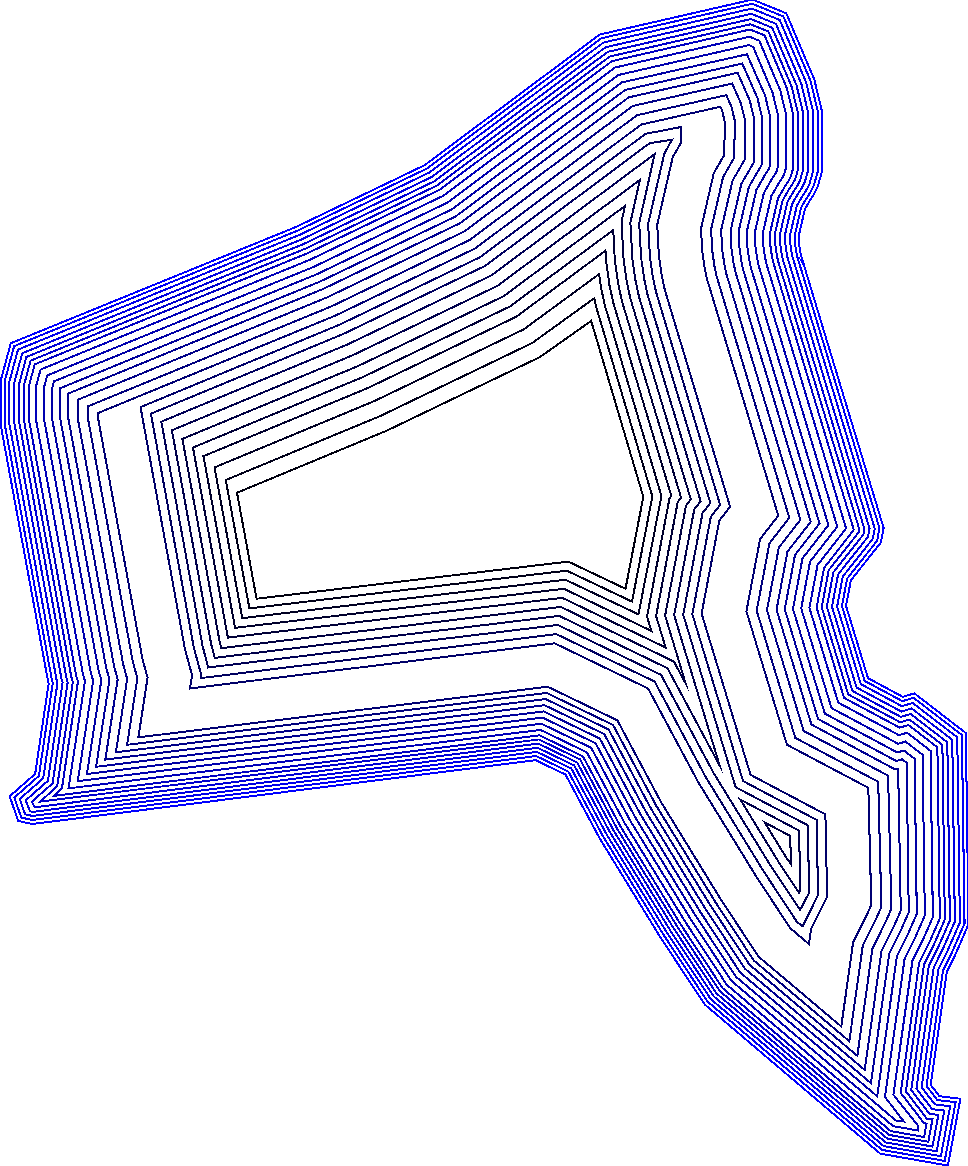
When the add-in has finished calculating the final round-trip, the output-sheets are filled with coordinates of the results, together with the calculated volumes at different heights. Additionally, images of the round-trips are saved. These images give a great visual overview of the round-trips and allow for very quick inspection of the excavated area.
This output can then be used for further processing, or inclusion in documents. In the case of Cubic Square, the output is often used in Rockware and the images are used for reports.
Next are a few images generated by Zandplas2007.